Tenant Selector
Unified Workflows + Multi-Tenant Reporting
I helped create a unified platform that streamlined tenant selection and multi-tenant reporting, reducing workflow friction and improving scalability for security analysts and thousands of enterprise customers.
Client
AT&T Cybersecurity
Role
Product UI Designer
Team
Worked with our UX Lead
Timeframe
5 Weeks
Skills
UI Design, Design Research, Wireframes, Design Systems, Accessibility, Prototyping


A final solution screen shot from Tenant Selector with 5 tenants selected.
Context
The Product
AT&T Cybersecurity’s USM platform provided multiple essential security capabilities in a single SaaS solution, including threat detection, incident response, and compliance management.
The Problem
For Managed Security Service Providers (MSSPs) managing dozens to hundreds of tenants simultaneously, the cybersecurity product couldn't keep up. Lists were hard to scan, selections were unclear, and reports could only run one tenant at a time.
My Role
As lead UI designer, I owned the interaction design and visual execution across the tenant selector, search, early group management, and multi-tenant reporting flows, working alongside the UX Lead.
Process
How might we scale large tenant lists (100+ tenants) on screen by defining column layout, row limits, flow direction, and scroll behavior to balance scan-ability and usability?
As tenant counts grew into the dozens and hundreds, the original patterns stopped holding up. Long lists and traditional modals became hard to scan. Excessive and multi-directional scrolling increased cognitive load. Switching context, managing selections, and running multi-tenant reports all got slower and more error-prone.
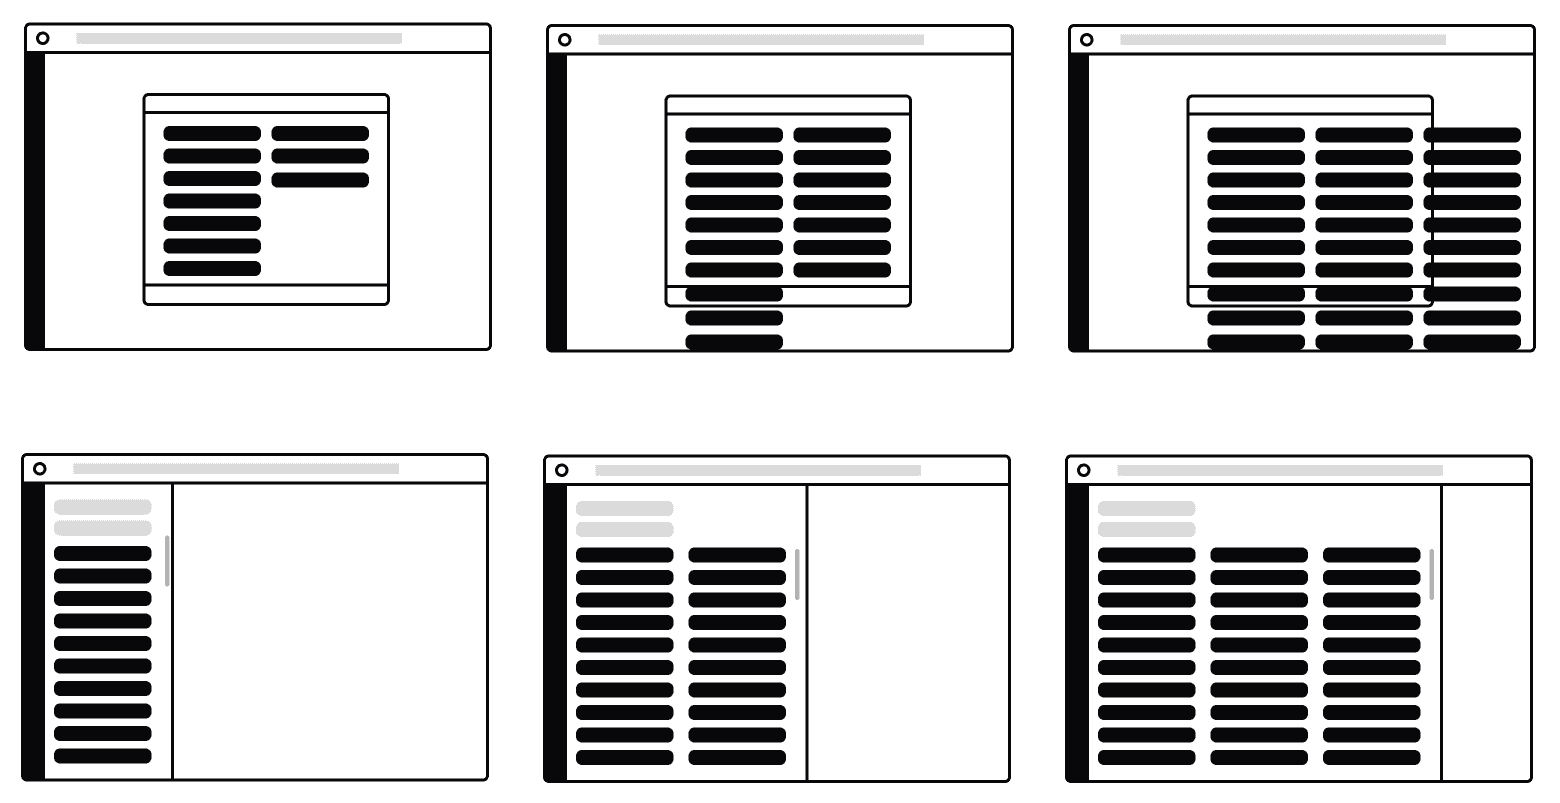

Applying core UX principles such as grouping/proximity, hierarchy, progressive disclosure, and clear state feedback, allowed the interface to scale without increasing cognitive load.
Grouping/Proximity - Available vs Selected tenants, tabs for Available Tenants and Groups.
Hierarchy - Titles, primary actions, and list items are visually weighted to guide the analyst through the workflow in sequence.
Progressive Disclosure - Search only appears on the Selected side once tenants are chosen.
Clear State Feedback - Checked states, count indicators ("5 of 172 Selected"), Clear Selection affordance.
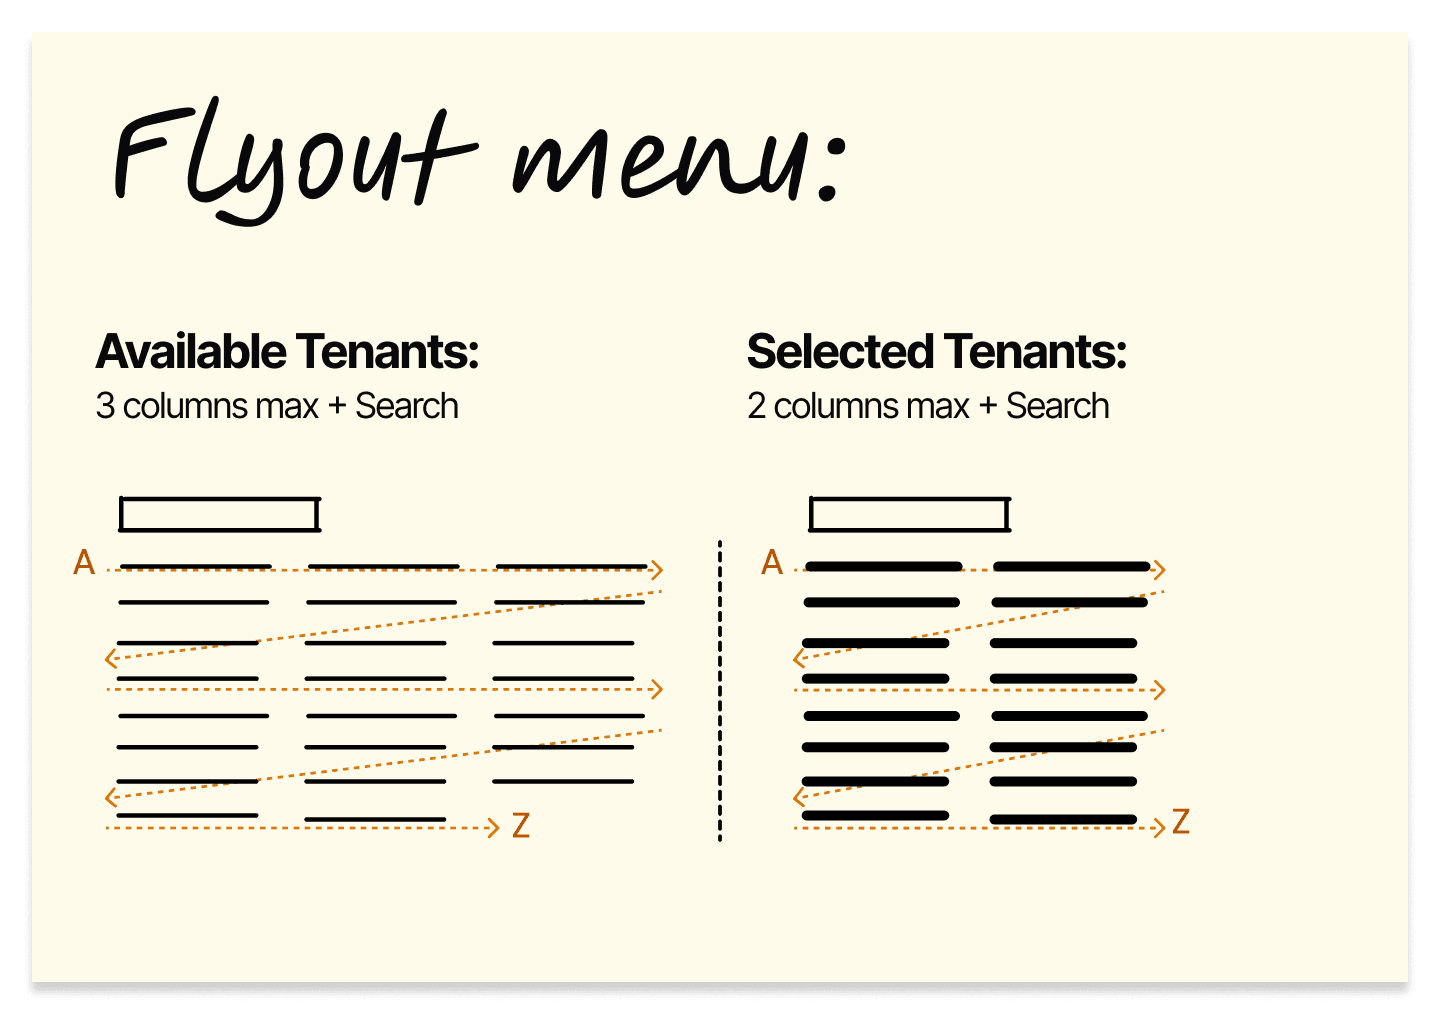
What didn't work in the higher fidelity design
Some things that didn't work or were rejected on some early designs.
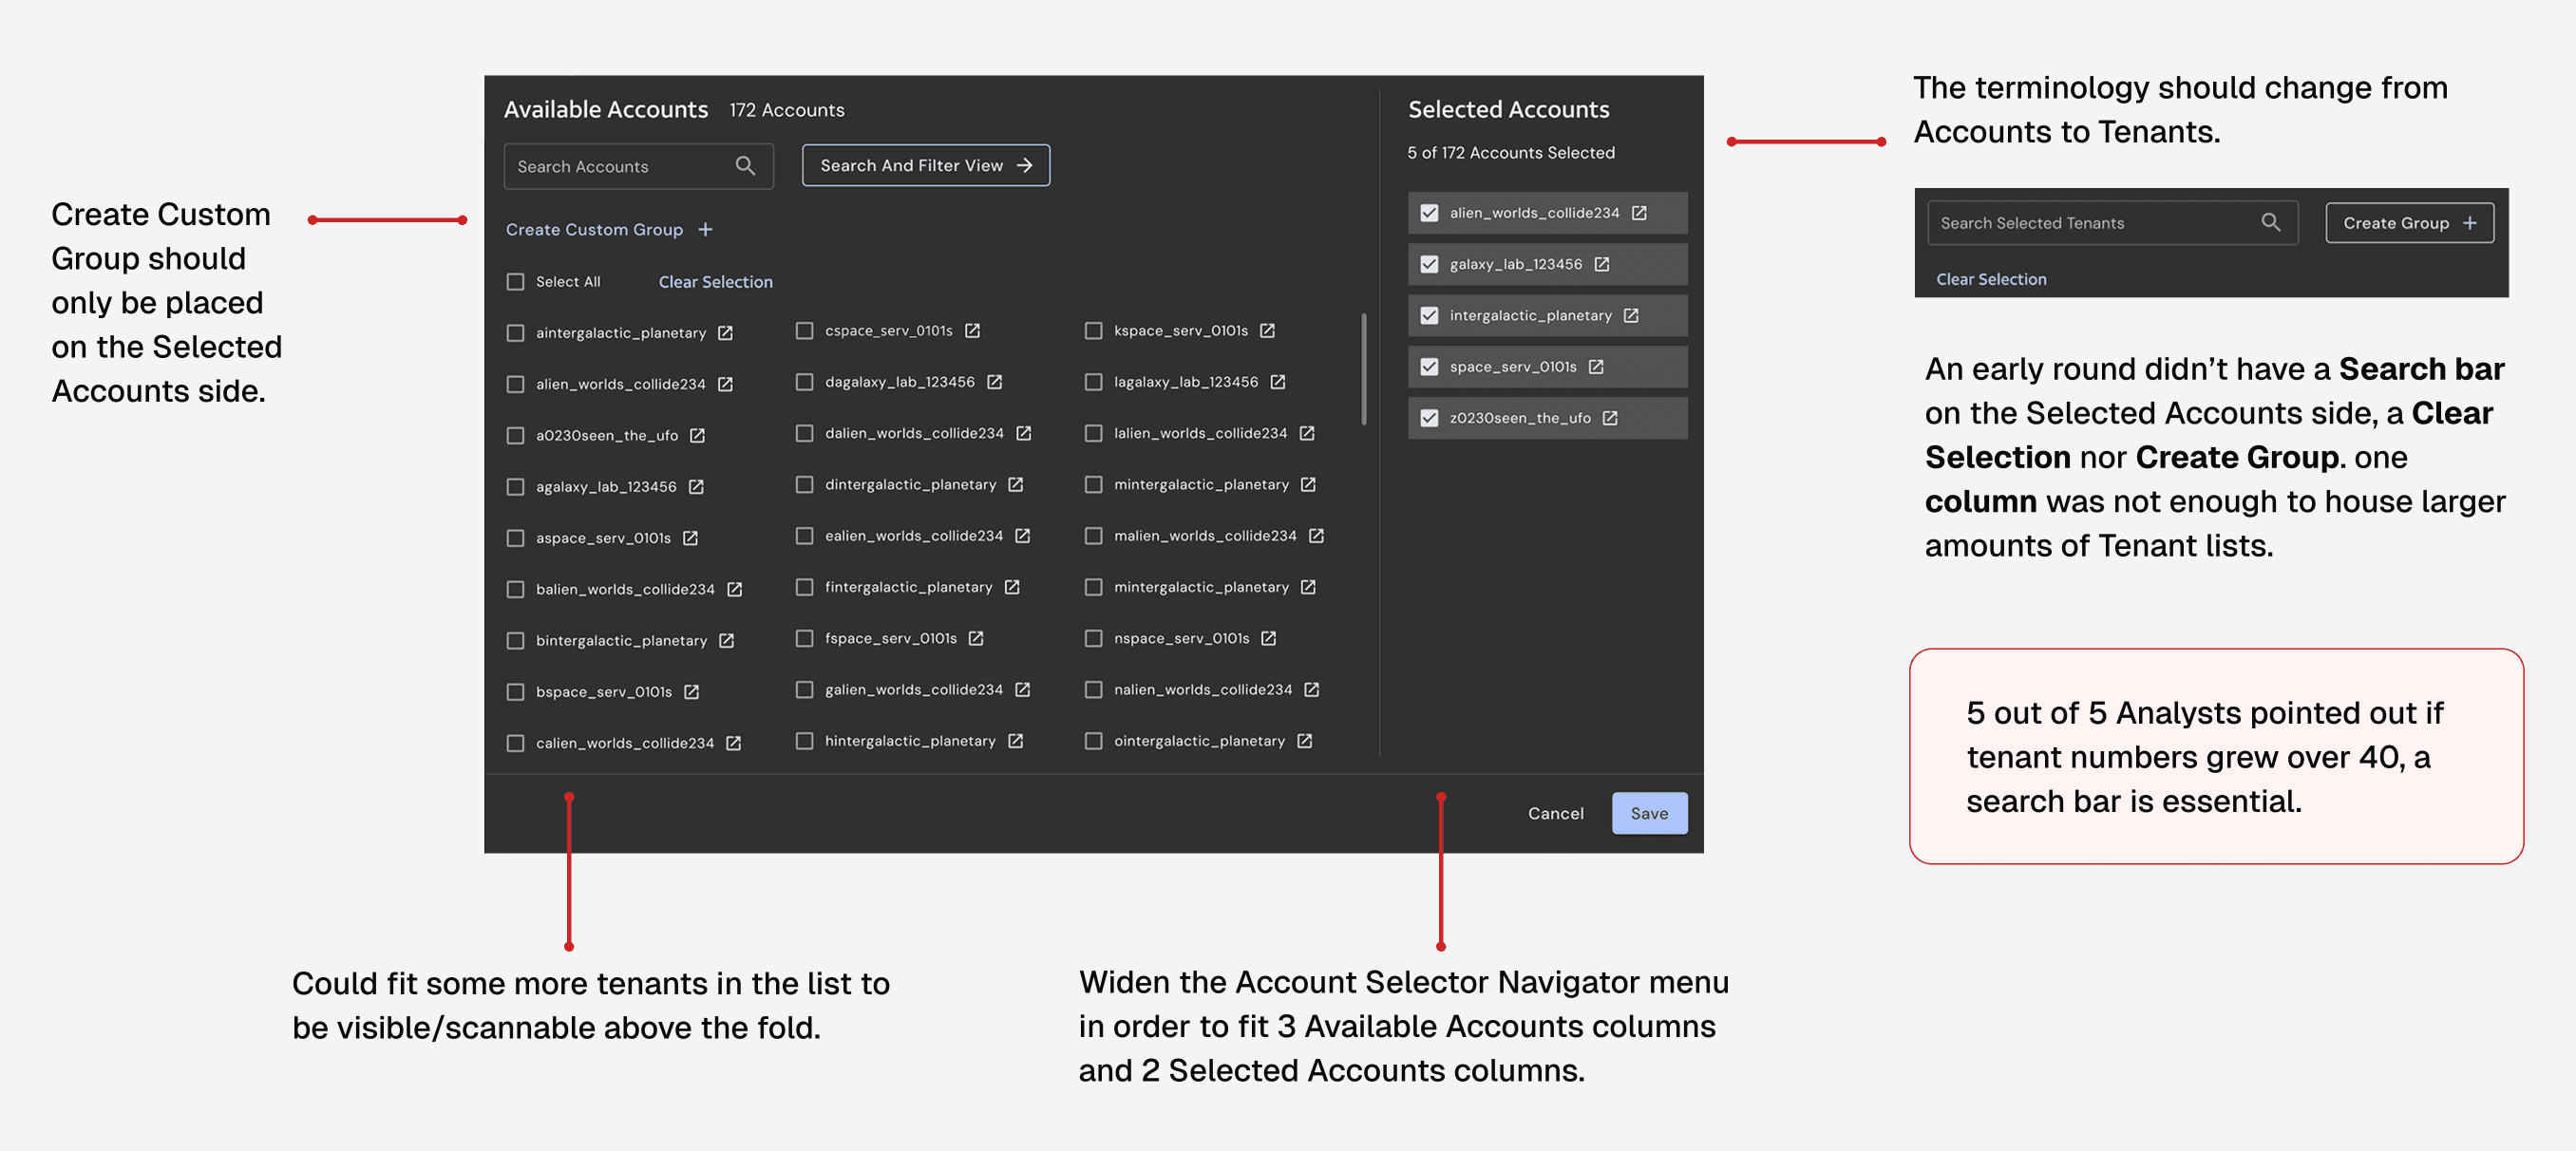
Early design with labels on what was rejected and what changed. Create Custom Group should only be placed on the Selected Accounts side. Could fit some more tenants in the list to be visible/scannable above the fold. Widen the Account Selector Navigator menu in order to fit 3 Available Accounts columns and 2 Selected Accounts columns. An early round didn’t have a Search bar on the Selected Accounts side, a Clear Selection nor Create Group. one column was not enough to house larger amounts of Tenant lists. 5 out of 5 Analysts pointed out if tenant numbers grew over 40, a search bar is essential.
Changing the designs based on the insights
Search bar added on the Selected Accounts side, a Clear Selection, Create Group reduced workflow disorientation and repetitive work. To accommodate the scale of Tenants and balance out the Available, two columns were needed.
Search Available Tenants and add to Selected.

Search Selected Tenants and delete.
Key Improvements
1 - Centralizing Tenant Management for large scale
Centralizing tenant selection and group management reduced context switching and made it easier for analysts to understand which data and actions applied to which tenants.
Tenant selector. Adding 5 tenants to product workflow.

A final solution screen shot from Tenant Selector with 100's of tenants selected.
2 - Search Available and Selected Tenants
A search bar was also added on the Selected Accounts side. This enabled analysts to search, add or delete multiple tenants.
Flows for both.

Search Available Tenants and add to Selected flow.

Search Selected Tenants and delete flow.
3 - Generate Report for Multiple Tenants
A key improvement was enabling multi-tenant reporting in one flow, replacing the prior one-tenant-at-a-time process. This removed a major operational limitation and reduced repetitive work for analysts, with fewer steps, less friction, and less manual effort per report.
Some static screens from multi-tenant reporting flows.

A final solution screen shot from Configure Report Tenant Selection flow.

A final solution screen shot from Configure Report Tenant Selection flow.
A sample prototype for Generate Report in a Multi-Tenant Environment (Desktop)
Don't Forget Light Mode

Tenant selector. Adding 5 tenants to product workflow.

Events page with 5 Tenants selected.
Outcomes & Impact
The unified platform experience streamlined tenant selection and multi-tenant reporting. This reduced operational cost and workflow friction, reduced risk and improved reporting reliability, and scaled the platform and enabled growth for hundreds of service providers and thousands of enterprise customers.
Reduced operational cost + workflow friction
Key Feature: Streamlined workflows by reducing manual, repetitive work. Fewer steps per task means less time spent on tenant navigation and reports.
Reduced risk + improved reporting reliability
Key Feature: Improved data accuracy and analyst confidence by centralizing tenant selection, reducing context switching and costly errors.
Scaled platform + enabled growth
Key Feature: Unified fragmented workflows into a single platform, now supporting hundreds of MSSPs and thousands of enterprise customers without added complexity.
Reflection & Growth
Designing at this scale taught me that familiar patterns break down fast. A list that works for 10 tenants becomes a real problem at 100. The challenge wasn't fitting more data on screen. It was keeping analysts oriented without piling on cognitive load.
Getting selection right shaped everything else. Bulk actions only work when users trust what they've selected. There were clear points where scrolling stopped being useful and search had to take over. That transition needed to be designed, not assumed.
If I'd had more time, I would have brought in usage data alongside usability testing to keep refining those handoff points as tenant volumes grew.